
Discover data relationships and connections to gain better actionable insights into improving your daily business operations by incorporating an effective digital strategy in visualizing your data. Equip data visualization software allowing you to perform an extensive list of things and utilize it to aid you with the process and achieve optimal results.
12+ Data Visualization Software
1. Sisense
2. Tableau

3. Looker

4. Domo

5. QlikView
6. Chartio

7. Data Box
8. Plotly
9. Klipfolio
10. Zoho Analytics

11. Reveal

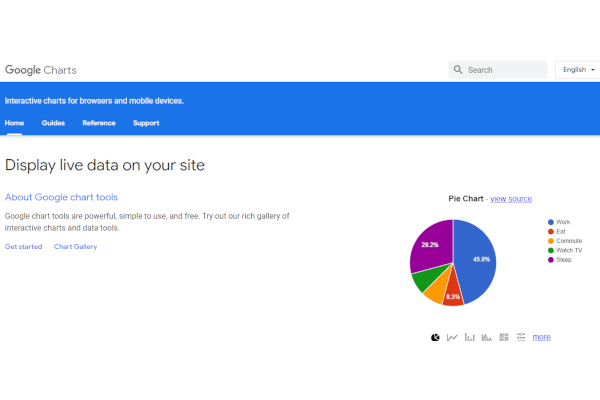
12. Google Charts
13. FusionCharts
What Is Data Visualization Software?
Data visualization software is a modern solution for converting numerical value and data analytics into visual diagrams. With this tool, end users can customize varying aspects according to how they like their data presented visually.
It allows customization with the table and graphs, with their colors, and allows attachment of media elements to make information more digestible. Also, this software centralizes the tools necessary for digitizing data visualization in a single platform. You can usually find this functionality integrated into a suite of data management solutions.
Benefits
Utilizing workflow automation capabilities using this software technology benefits your organization in multiple ways. For one, it heightens accuracy in your workflows and eliminates the need to undergo repetitive manual processes when generating graphs and tables. That said, it takes items off your plate while putting more on the table.
Features
Studying your choice in the software market and determining the ways they can help you move towards your strategic goals is a challenging process, even a little overwhelming. Although one thing to do to filter them effectively and set them apart is to know what to look out for and the aspects to focus on when making your decision. You should consider their offered software packages, pricing plans, interface design, capabilities for third-party integration, and their supported digital devices. The following are features your software should have:
- Diagramming software functionalities
- Customizable dashboard
- Pre-built templates
- Data extraction tools
- Collaboration software features
- File sharing capabilities
- Powerful reporting functionalities
- Third-party applications integration
Top 10 Data Visualization Software
1. Zoho Analytics
KPI monitoring tools and data connectors are features you can use in this business intelligence software. Its developer, Zoho, has generated a revenue of 2 billion dollars and has employed 10,000 people.
2. Tableau
This data analysis solution offers machine learning and predictive analytics functionalities. They have a revenue of 877 million dollars and have employed 4,181 people.
3. QlikView
With QlikView, you can simplify the complexities involved in visual workflow management and high volume processing. They have 2,600 employees in their team and have a generated revenue of 679 million dollars.
4. Domo
With this data management software, you can use information governance and benchmarking capabilities. They have 173 million dollars in revenue and have 1,000 people working for them.
5. Sisense
This reporting software has tools for financial reporting and collaboration functionalities. They have 849 people in their team and have 120.1 million dollars in revenue.
6. Looker
With this big data software, you can optimize processes to improve your goal tracking and profitability analysis activities. They have 507 people working for them and have 118.2 million dollars in revenue.
7. Klipfolio
Functionalities for creating dashboards and a drag-and-drop capability are features accessible in this reporting software. They have 66 people in their team and have 13 million dollars in generated revenue.
8. Data Box
Data Box is a digital solution with business analytics tools and scorecards. They have 57 employees and have a revenue of 8.3 million dollars.
9. Chartio
Chartio is a business intelligence solution that provides custom templates and problem indicators. They have 7.7 million dollars in revenue and have 53 employees working for them.
10. Plotly
Plotly is a platform that provides application development and embedded analytics features. They have a revenue of 6.8 million dollars and have 47 employees in their team.
FAQs
Why is data visualization essential?
Data visualization makes it easier to analyze and process big data from multiple sources. That said, it allows you to track the status and progress of your processes and map pain points to determine issues with business functions. Another importance of data visualization for businesses is it helps in identifying trends in the market for more targeted business plans.
What are formats for data visualization?
There are multiple types of graphs used by organizations depending on varying factors. It could vary based on the purpose, the size of the data, and the audience for communicating the data. Examples of the widely used formats are the pie chart, bar graph, line chart, pyramid chart, heat map, funnel chart, bullet graph, and the list continues.
What is business intelligence software?
Business intelligence software is an intelligent and modern solution for gathering data across multiple software applications and measuring performance metrics to determine the effectiveness of business processes. Most BI software uses artificial intelligence to make informed decisions and predictions. It provides a data warehouse and content and document management for better information sharing and knowledge transfer practices.
Get the data you need to ensure operational efficiency and organizational effectiveness as you implement your strategies and plans by having a seamless data visualization experience. Have the best data visualization software to help you achieve that feat and start establishing and ingraining a culture centered on data in your workflows.
Related Posts
10+ Best Chemical Software for Windows, Mac, Android 2022
12+ Best Vulnerability Scanner Software for Windows, Mac, Android 2022
4+ Best Bundled Pay Management Software for Windows, Mac, Android 2022
10+ Best Trust Accounting Software for Windows, Mac, Android 2022
10+ Best Patient Portal Software for Windows, Mac, Android 2022
13+ Best Virtual Reality (VR) Software for Windows, Mac, Android 2022
12+ Best Bed and Breakfast Software for Windows, Mac, Android 2022
15+ Best Resort Management Software for Windows, Mac, Android 2022
14+ Best Hotel Channel Management Software for Windows, Mac, Android 2022
12+ Best Social Media Monitoring Software for Windows, Mac, Android 2022
10+ Best Transport Management Software for Windows, Mac, Android 2022
10+ Best Other Marketing Software for Windows, Mac, Android 2022
10+ Best Top Sales Enablement Software for Windows, Mac, Android 2022
8+ Best Industry Business Intelligence Software for Windows, Mac, Android 2022
10+ Best Insurance Agency Software for Windows, Mac, Android 2022