
By combining an efficient digital strategy with the visualization of your data, you may discover data links and connections to acquire greater actionable insights into enhancing your everyday company operations. Equip yourself with data visualization software tools that enable you to carry out a long list of tasks. You can also make use of them to help you with the process and get the best results.
10+ Best Data Visualization Tools Software
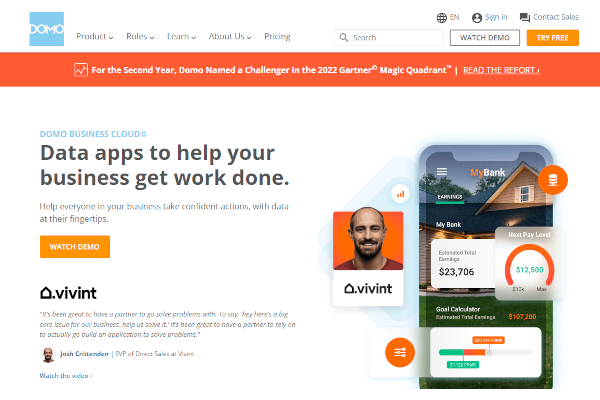
1. Domo
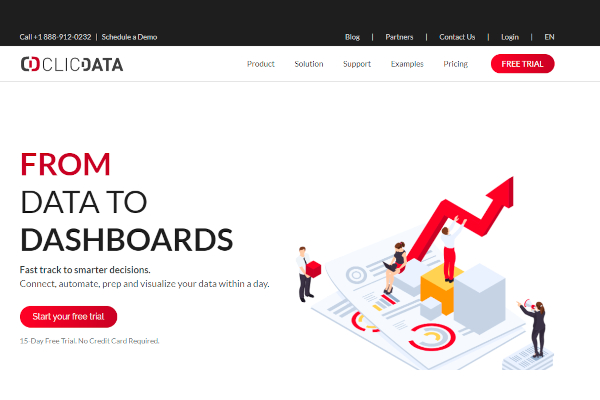
2. ClicData
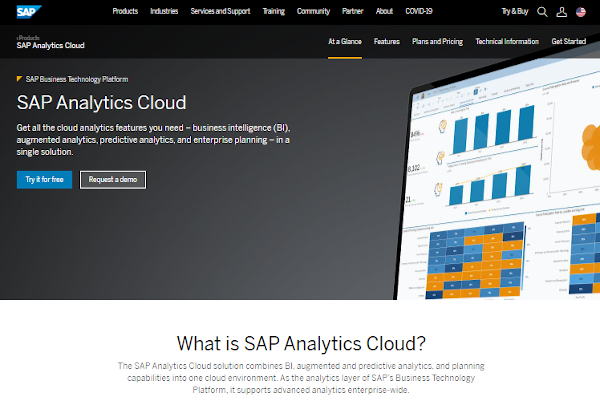
3. SAP Analytics Cloud
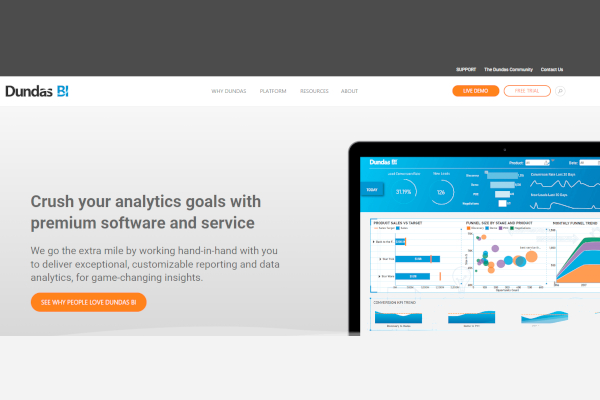
4. Dundas BI
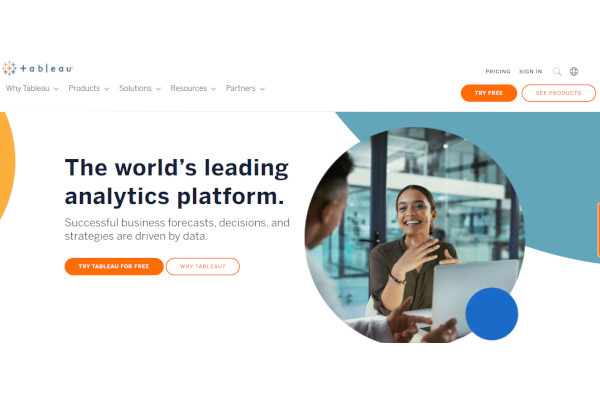
5. Tableau
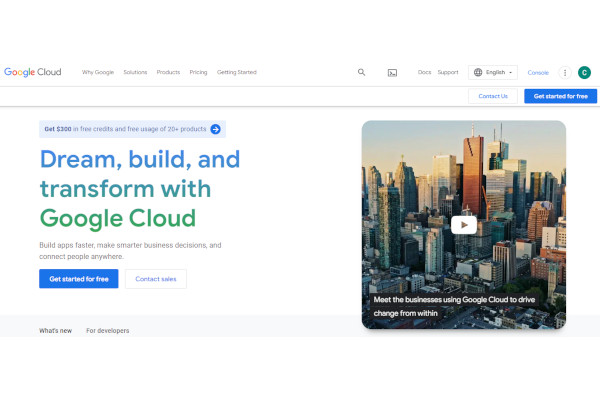
6. Google Cloud Platform
7. Microsoft Power BI

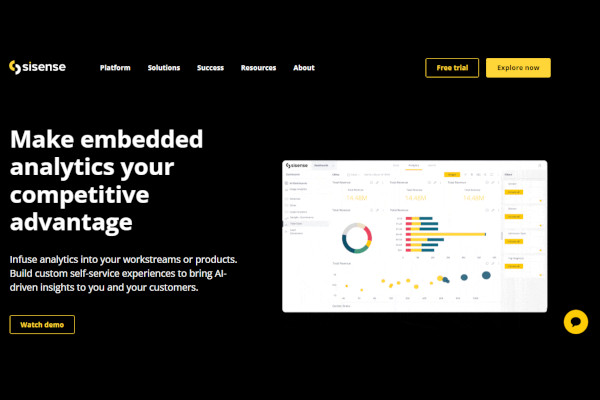
8. Sisense
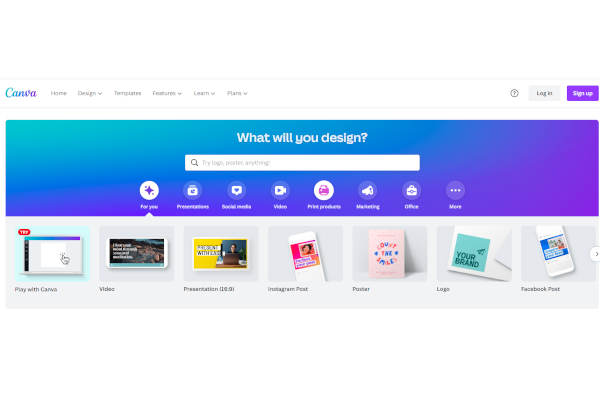
9. Canva
10. Minitab
11. ActivTrak
What Is Data Visualization Software Tool?
Modern methods for visualizing numerical value and data analytics include data visualization software. With this tool, users may alter a variety of features based on how they like their data to be displayed aesthetically. To make information easier to understand, it offers modification of the table and graphs’ colors and allows for the inclusion of desktop media assets. Additionally, this program centralizes on a single platform all the tools required for digitizing data visualization. This feature is often included in a package of data management tools.
Benefits
This software technology’s workflow automation capabilities have several advantages for your company. For starters, it improves workflow accuracy and does away with the need for tedious manual procedures when creating graphs and tables. However, it adds more to the table while removing certain things from your plate.
Features
Studying your software options and figuring out how they might assist you in achieving your strategic objectives is a difficult and perhaps intimidating task. Knowing what to watch out for and what to prioritize when making your choice is one way to successfully separate them and set them apart. You should take into account their software packages, cost, interface style, ability to integrate with other parties, and supporting digital devices. Your program needs the characteristics listed below:
- File sharing
- Templates
- Data extraction functions
- Diagramming
- Powerful reporting
- Third-party applications integration
- Customizable dashboard
- Collaboration software
Top 10 Data Visualization Software Tools
1. FusionCharts Suite XT
A provider of data visualization products, FusionCharts is a part of InfoSoft Global. More than 80% of Fortune 500 companies use it. In 2001, Pallav Nadhani, then 16 years old, who was working on a school assignment, discovered FusionCharts and was dissatisfied with Microsoft Excel’s charting capabilities.
2. Sisense
For those seeking the best free Data Visualization tools, Sisense is a business insight platform that enables you to envision the insights you need to decide on better and smarter management decisions. Employ a coordinated review procedure using a variety of informed perspectives.
3. IBM Watson Analytics
One of the best free tools is IBM’s cloud-based investigation administration, Watson Analytics, which helps you quickly find patterns in your data. When you transmit your information to Watson Analytics, it displays the questions it can help you with addressing and then instantly provides you with informed perspectives based on it.
4. Zoho Analytics
A business information analysis platform called Zoho Analytics makes use of a number of tools, such as KPI gadgets, rotational tables, and unimaginable view components, to enable it to generate reports that include important business experiences.
5. Tableau Desktop
One of the finest tools for helping you view and understand your data is Tableau Desktop, which combines data from several sources in a matter of seconds. By doing this, you may use custom channels and their limited capabilities to create intuitive and adaptive dashboards. Scene claims to deal broadly with how you think—asking questions, contrasting viewpoints, and determining significance.
6. Infogram
Uldis Leiterts, Raimonds Kaze, and Alise Semjonova founded the graphical and information representation company Infogram in 2012.
7. D3.js
Information Driven Documents, abbreviated as “.js D3.js,” is the moniker that first comes to mind when we consider the tools. It renders some incredible graphs and charts using HTML, CSS, and SVG.
8. Microsoft Power BI
With the help of Microsoft Power BI, businesspeople may easily externally deconstruct their data and set up operations that rely on it.
9. Datawrapper
Datawrapper is by no means challenging. The greatest tools for creating representations, such as infographics, maps, information tables, and adaptive graphs like lines, bars, and so on, are extremely simple to use.
10. QlikView
An item connection of Qlik in Radnor, Pennsylvania, and the USA is QlikView. One of the fastest-growing business insight visualization tools and visual tools that are challenging to interact with is QlikView.
FAQs
Is data visualization software important for the business?
Big data processing and analysis are made simpler by data visualization. Having said that, it enables you to map pain spots to identify problems with business activities and monitor the status and development of your processes. The ability to discover market trends for more specialized business planning is another benefit of data visualization for firms.
How many formats are there for data visualization?
Organizations utilize a variety of graph types based on a variety of criteria. Depending on the objective, the volume of the data, and the intended audience, it could change. Pie charts, bar graphs, line graphs, pyramid charts, heat maps, funnel diagrams, bullet diagrams, and a long list of other commonly used styles are examples.
What are business intelligence software used for?
Company intelligence software is an intelligent and contemporary way to collect information from various software programs, measure performance indicators, and assess how well business processes are working. Artificial intelligence is a common feature of BI software that helps it make smart judgments and predictions. It offers a data warehouse, content management, and document management for improved knowledge transfer procedures.
Utilize a seamless data visualization experience to get the information you need to guarantee organizational performance and operational efficiency as you put your strategy and plans into action. Utilize the finest data visualization tools to assist you in achieving this goal, and begin fostering a data-driven culture across your operations.
Related Posts
10+ Best Chemical Software for Windows, Mac, Android 2022
12+ Best Vulnerability Scanner Software for Windows, Mac, Android 2022
4+ Best Bundled Pay Management Software for Windows, Mac, Android 2022
10+ Best Trust Accounting Software for Windows, Mac, Android 2022
10+ Best Patient Portal Software for Windows, Mac, Android 2022
13+ Best Virtual Reality (VR) Software for Windows, Mac, Android 2022
12+ Best Bed and Breakfast Software for Windows, Mac, Android 2022
15+ Best Resort Management Software for Windows, Mac, Android 2022
14+ Best Hotel Channel Management Software for Windows, Mac, Android 2022
12+ Best Social Media Monitoring Software for Windows, Mac, Android 2022
10+ Best Transport Management Software for Windows, Mac, Android 2022
10+ Best Other Marketing Software for Windows, Mac, Android 2022
10+ Best Top Sales Enablement Software for Windows, Mac, Android 2022
8+ Best Industry Business Intelligence Software for Windows, Mac, Android 2022
10+ Best Insurance Agency Software for Windows, Mac, Android 2022