
Business competition is amplifying as time passes by. Companies need to generate new ideas to ensure they reach the top in the business competition. For this reason, evaluating historical and current data is necessary. To help you obtain accurate data analytics and analysis, you might need prescriptive analytics software. Continue reading below for more.
10+ Best Prescriptive Analytics Software
1. AIMMS Platform
2. RapidMiner
3. Sisense
4. Birst BI
5. KNIME Analytics Platform
6. Talend Data Fabric
7. Looker

8. Tableau

9. IBM Cognos
10. Alteryx APA
11. IBM Planning Analytics with Watson
What is Prescriptive Analytics Software?
Decisions play a critical role in the business industry. Business decisions effects daily operations, processes, management, and more. That is why it is essential to perform accurate forecasting and plan faultlessly. For this reason, experts developed prescriptive analytics software to help you examine your taken actions, evaluate results, and generate an effective action plan to drive your business to your goal. It is a technological tool with multiple advanced features and functionalities, giving accurate and informative data while offering you cloud file storage to save big data within a single platform.
Benefits
Prescriptive analytics software delivers multiple benefits and advantages to your company. It is a technology partner that improves long-term strategies and collaboration processes, leading your team to have comprehensive discussions. Prescriptive analytics software enables enhanced risk management, supply chain planning, investment decisions, financial analysis, sales forecasting operations while reducing risks and optimizing overall production.
Features
It is necessary to analyze the features and functionalities of the software to choose the best software for your company. Software is expensive; they are a great investment and can be a long-term investment. It is crucial to pick the best to avoid wasting time and money on irrelevant ones. Several technology firms that developed prescriptive analytics software have similar and unique characteristics that you might find innovative and unnecessary. You can reach through a software comparison website with software reviews from users to obtain heads up on what you should buy. Below are features you might need:
- Campaign Management
- Conversion Tracking
- Data Visualization
- Demand Forecasting
- Business Dashboard
- Financial Reporting
- Forecasting
Top 10 PRescriptive Analytics Software
1. Looker
Looker from Google includes application development, audience targeting, campaign management, strategic planning, statistical analysis, and more contributive features. Google has annual revenue of $257 billion and 156,500 employees.
2. Tableau
Tableau from Salesforce includes data analysis tools, data management, profitability analysis, financial reporting, sales reports, and more logical features. Salesforce has annual revenue of $25 billion and 73,541 employees.
3. Birst BI
Birst BI from Infor includes ETL/data preparation, operational reporting, visual data discovery, interactive dashboards, advanced analytics, and more. Infor has annual revenue of $3 billion and 17,000 employees.
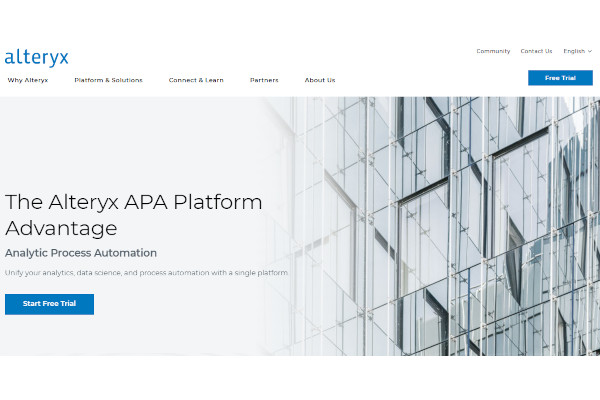
4. Alteryx APA
Alteryx APA includes ad hoc reporting, data analysis tools, data integration, demand forecasting, statistical process control, process management, and more valuable features. Alteryx has annual revenue of $522.9 million and 2,251 employees.
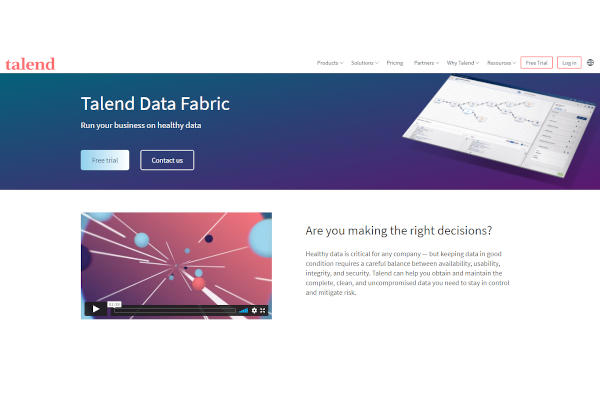
5. Talend Data Fabric
Talend Data Fabric is the only platform that combines a broad set of data integration and governance capabilities to actively monitor the health of business information. Talend has annual revenue of $337.2 million and 1,626 employees.
6. Sisense
Sisense includes benchmarking, customizable dashboards, data quality control, data visualization, and more innovative features. Sisense has annual revenue of $167.4 million and 836 employees.
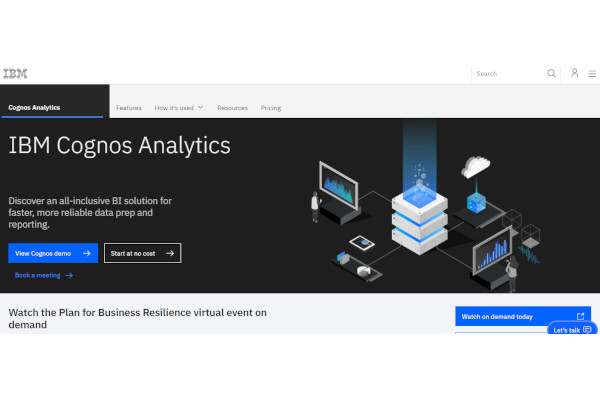
7. IBM Cognos
IBM Cognos includes high volume processing, KPI monitoring, forecasting, data visualization, ad hoc reporting, key performance indicators, and more advanced features. IBM has annual revenue of $57 billion and 282,100 employees.
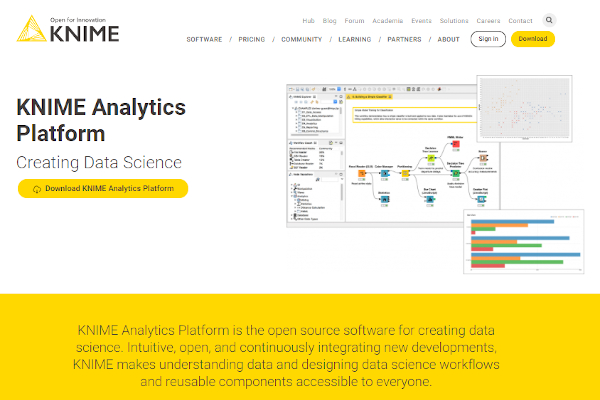
8. KNIME Analytics Platform
KNIME Analytics Platform includes ad hoc reporting, predictive analytics, workflow management, data transformation, and more helpful features. KNIME has annual revenue of $25.9 million and 168 employees.
9. RapidMiner
RapidMiner includes data visualization, fraud detection, process change tracking, machine learning, sentiment analysis, and more valuable features. RapidMiner has annual revenue of $15.1 million and 108 employees.
10. AIMMS Platform
AIMMS Platform includes pricing optimization, strategic sourcing, workforce scheduling, managing energy systems, project portfolio optimization, and more advanced features. AIMMS has an annual revenue of $15 million and 80 employees.
FAQs
What is data analytics?
Data analytics is sets of data regarding the company’s performance, market demand, trend analysis, financial analysis, and overall business operations. It is usually shown as numbers, graphs, and dashboards giving the professional industry insights and visibilities to enhance decision-making processes. For this reason, data analytics is a critical element in multiple industries.
What is predictive analytics?
Predictive analytics is data that helps the business industry predict and forecast the possibilities they might face. Predicting possibilities is a crucial activity. It assists in generating action plans and other preparations to improve profits and sales while reducing risk and preparing for challenges along the way. This process also aids in making news products and services due to accurate trend analysis.
Why is data advantageous?
In the modern era, the professional industry uses data to obtain convenient methods in their overall operations. Using data allows you to be less dependent on actual papers. Managing physical papers is challenging, especially when you need to examine them manually. On the other hand, data is electronic files and analytics, allowing companies to communicate, collaborate, and generate plans effectively and efficiently.
Traditional methods have limitations, are time-consuming, and are a lot of work. On top of that, it always fails in meeting your expectations. Using prescriptive analytics software is the best choice to enhance your collaborative operations and decision-making processes; it automates processes, offers accurate statistical analysis, collaboration tools, a comprehensive dashboard, etc. With this tool, you can boost productivity while ensuring reliable data.
Related Posts
10+ Best Chemical Software for Windows, Mac, Android 2022
12+ Best Vulnerability Scanner Software for Windows, Mac, Android 2022
4+ Best Bundled Pay Management Software for Windows, Mac, Android 2022
10+ Best Trust Accounting Software for Windows, Mac, Android 2022
10+ Best Patient Portal Software for Windows, Mac, Android 2022
13+ Best Virtual Reality (VR) Software for Windows, Mac, Android 2022
12+ Best Bed and Breakfast Software for Windows, Mac, Android 2022
15+ Best Resort Management Software for Windows, Mac, Android 2022
14+ Best Hotel Channel Management Software for Windows, Mac, Android 2022
12+ Best Social Media Monitoring Software for Windows, Mac, Android 2022
10+ Best Transport Management Software for Windows, Mac, Android 2022
10+ Best Other Marketing Software for Windows, Mac, Android 2022
10+ Best Top Sales Enablement Software for Windows, Mac, Android 2022
8+ Best Industry Business Intelligence Software for Windows, Mac, Android 2022
10+ Best Insurance Agency Software for Windows, Mac, Android 2022