
With how data collection practices have significantly improved throughout the continuous development in digital technology, so did the methods of presenting data. That said, be in the know of this innovative solution and start generating necessary reports with just a few clicks and never worry again about taking too much time with it. Get your reporting dashboard software here as early as now.
10+ Best Reporting Dashboard Software
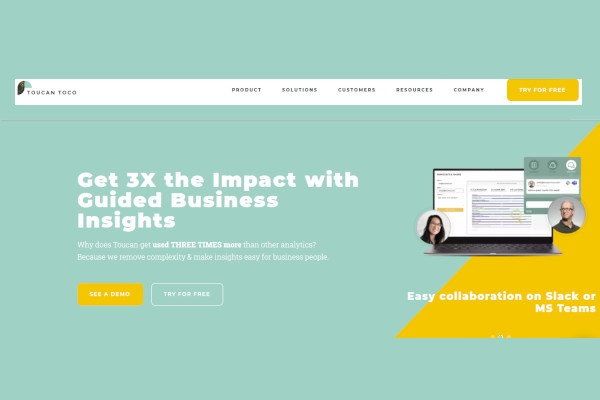
1. Toucan Guided Analytics
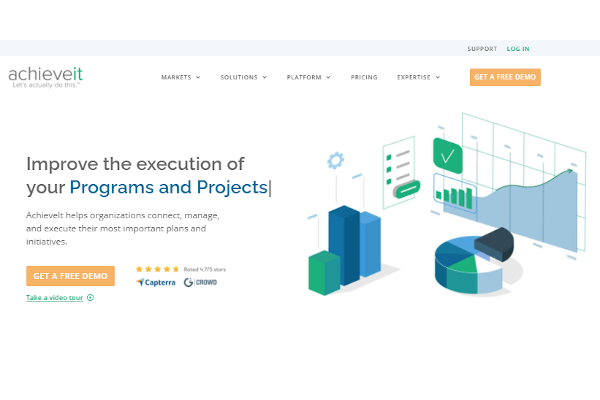
2. AchieveIt
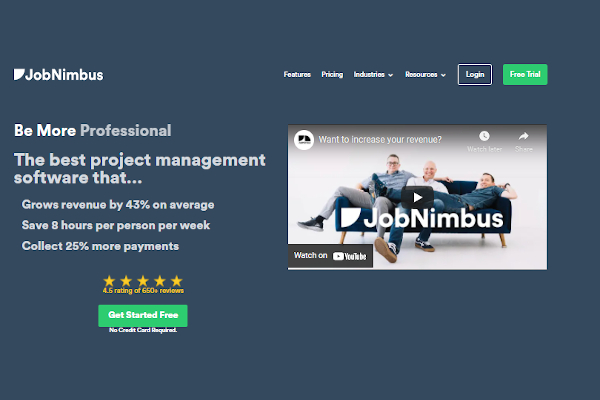
3. JobNimbus
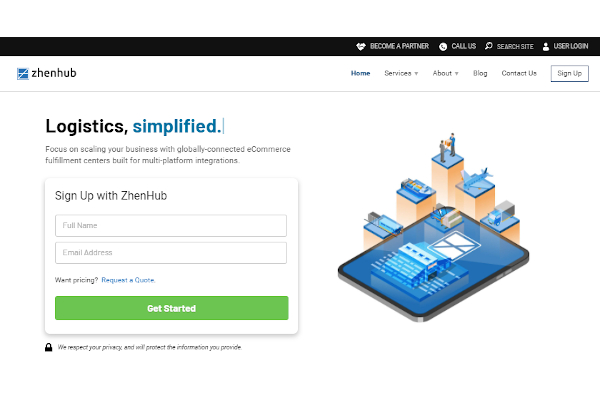
4. ZhenHub
5. Infogram
6. Tableau

7. Klipfolio
8. DashThis
9. Looker

10. Sisense
11. Domo

What Is Reporting Dashboard Software?
Reporting dashboard software is a modern solution that provides a platform that digitizes processes for creating business reports. It has data analytics tools for tracking data across varying platforms, centralizing them in a single network. With this technology, you can utilize customizable templates and pick out the diagramming method you prefer to use for visually representing specific data.
You can choose the chart, color, font, and size necessary to align it with your reporting needs. Also, it allows you to access a component library and offers image editor capabilities for your media attachments.
Benefits
Digitizing your report generation processes using reporting dashboard software eliminates the worries for untidiness and other complexities when making needed changes on data in the report. Also, its capability for workflow automation increases the accuracy and consistency of business data and minimizes the possibility for human errors or overlooking essential details in the process.
Features
One of the buying considerations you should study is how easily you can navigate, understand, and incorporate available software choices into your daily operations. Besides their interface designs, there is a long list of other aspects that require your attention when deciding in the software market. The prices of the software packages and capabilities for workflow configuration belong on the list. An effective reporting dashboard software should also have the following features:
- Data visualization tools
- Data collection functionalities
- Data management capabilities
- Font management features
- KPI monitoring functionalities
- Data security tools
- ROI tracking features
- Flowchart maker tools
- Diagramming capabilities
- CRM software integration
Top 10 Reporting Dashboard Software
1. Tableau
Tableau is a data management software with customer journey mapping and financial reporting capabilities. They have 282 million dollars in generated revenue and have 3,800 people working for them.
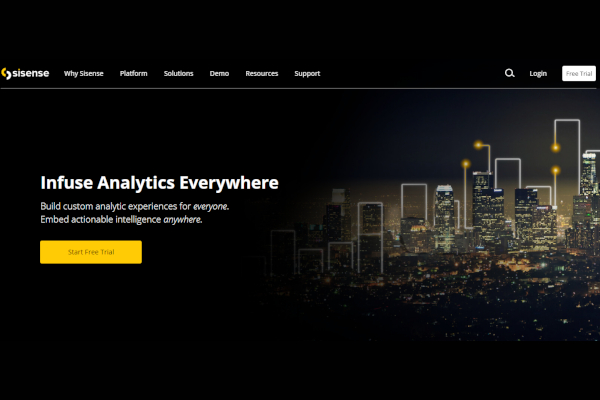
2. Sisense
Streaming analytics and mobile reporting capabilities are features you can use in this reporting platform. They have generated 167.4 million dollars in revenue and have employed 836 people.
3. Looker
Functionalities for ROI tracking and profitability analysis are accessible in this big data software. They have a generated revenue of 76.3 million dollars and have 429 employees working for them.
4. JobNimbus
With this construction management solution, you can streamline the processes for overseeing lead management and estimating tasks. They have 125 employees working for them and have 26 million dollars in revenue.
5. Toucan Guided Analytics
This reporting solution has data preparation functionalities and an activity dashboard. They have 18 million dollars in generated revenue and have 120 people on their team.
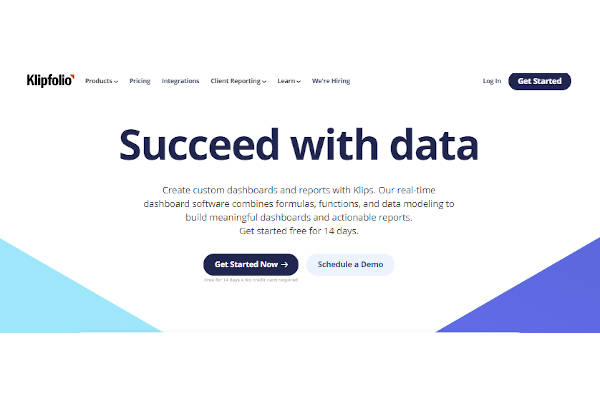
6. Klipfolio
Klipfolio is a dashboard software that provides users with custom reports and visual analytics features. They have 66 employees and have 13 million dollars in generated revenue.
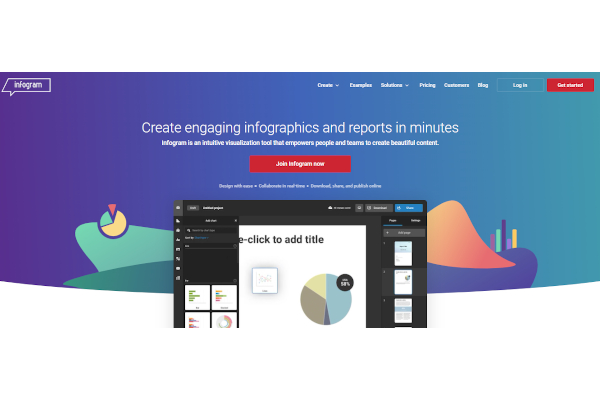
7. Infogram
With Infogram, you can simplify the complexities involved in data import & export and real-time data tracking. They have 48 employees in their team and have 7 million dollars in revenue.
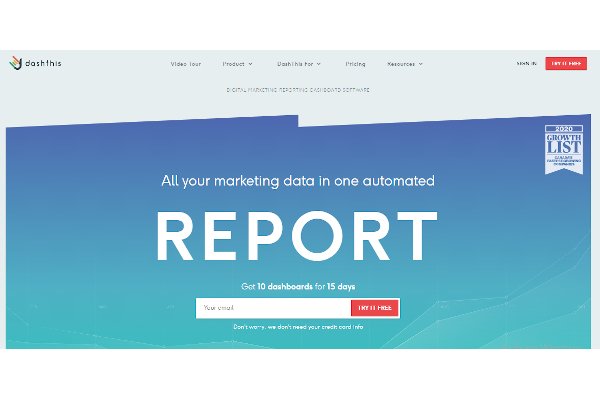
8. DashThis
DashThis is a social media analytics software with engagement tracking and campaign analytics features. They have 6 million dollars in generated revenue and have 34 people on their team.
9. AchieveIt
This OKR software has digital tools for business performance management and goals setting. They have a revenue of 4.1 million dollars and have 39 employees.
10. ZhenHub
With this supply chain management software, you can use inventory optimization and cataloging capabilities. They have employed eight people and have 2.4 million dollars in generated revenue.
FAQs
Why are dashboards reports essential in businesses?
Dashboards improve the visibility and transparency of your data to ensure you can leverage historical data and business intelligence when generating a business plan. Also, dashboard reporting allows you to recognize patterns and determine relationships in data to ensure you can invest and allocate your resources on the right digital marketing strategies to improve results.
What are essential tips for creating dashboards successfully?
When creating dashboards, there are elements you need to consider. One, you know your objectives for generating the dashboard. Also, you should consider your audience to identify the type of format and approach to go for in your data presentation. Your choice of design, font, color, and chart should also complement each other.
What is business intelligence software?
Business intelligence software is the modern technology for processing, analyzing, and preparing information collected from internal and external sources and data warehouses to gain better insights into the current market trends and business profitability. Also, it runs an operational audit to map gaps in the processes and identify business opportunities.
Generate your reporting dashboards how you like them and when you like them and adjust them according to the needs of your audience to seamlessly communicate the message you want to get across. Download the best reporting dashboard for you today to establish a data-driven workforce culture and optimize your processes to maximize results.
Related Posts
10+ Best Chemical Software for Windows, Mac, Android 2022
12+ Best Vulnerability Scanner Software for Windows, Mac, Android 2022
4+ Best Bundled Pay Management Software for Windows, Mac, Android 2022
10+ Best Trust Accounting Software for Windows, Mac, Android 2022
10+ Best Patient Portal Software for Windows, Mac, Android 2022
13+ Best Virtual Reality (VR) Software for Windows, Mac, Android 2022
12+ Best Bed and Breakfast Software for Windows, Mac, Android 2022
15+ Best Resort Management Software for Windows, Mac, Android 2022
14+ Best Hotel Channel Management Software for Windows, Mac, Android 2022
12+ Best Social Media Monitoring Software for Windows, Mac, Android 2022
10+ Best Transport Management Software for Windows, Mac, Android 2022
10+ Best Other Marketing Software for Windows, Mac, Android 2022
10+ Best Top Sales Enablement Software for Windows, Mac, Android 2022
8+ Best Industry Business Intelligence Software for Windows, Mac, Android 2022
10+ Best Insurance Agency Software for Windows, Mac, Android 2022