
In order to ensure that all employees have access to the most up-to-date information and that business choices are well-informed, effective reporting tools are essential. To get started, use a data reporting tool to examine your data and extract the pertinent information. Quickly and easily create eye-catching graphs and charts with only a few clicks thanks to its intuitive drag-and-drop user interface. Our pre-built dashboard templates make it easy to get started making customized reports in no time. On your own time, you may do analyses and generate reports.
10+ Best Top Reporting Software
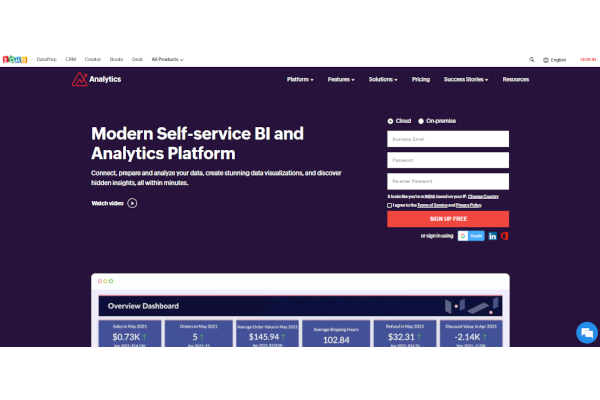
1. Zoho Analytics
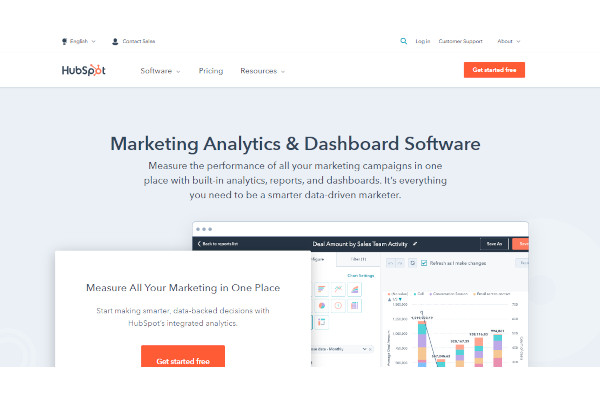
2. HubSpot Marketing Analytics
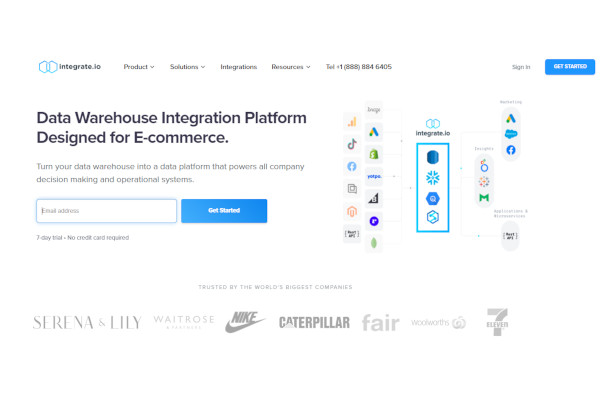
3. Integrate.io
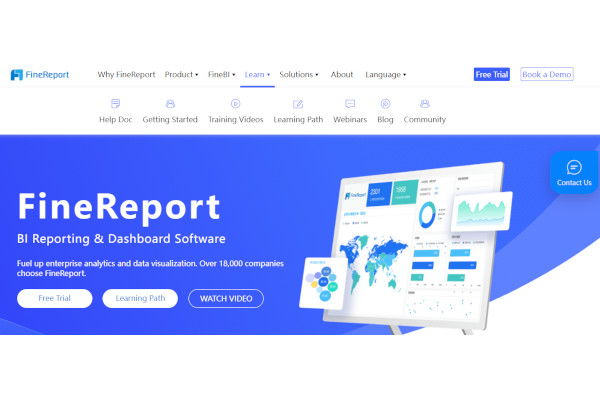
4. FineReport
5. Query.me
6. Answer Rocket
7. SAP Crystal Reports
8. DBxtra
9. Datadog
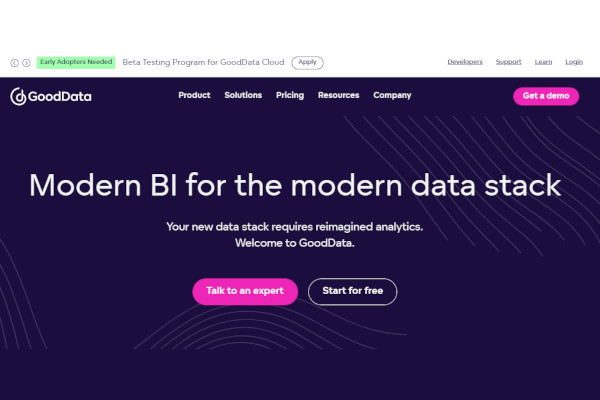
10. GoodData
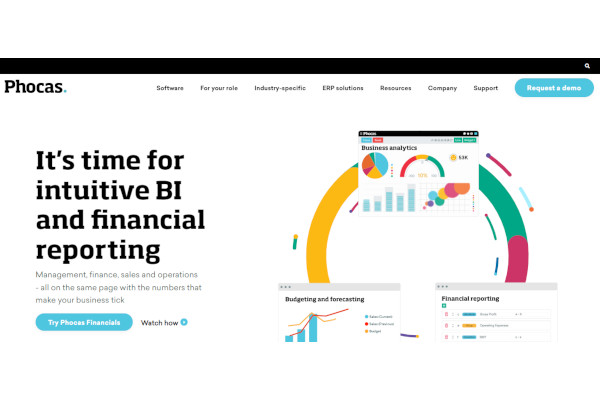
11. Phocas
What Is Top Reporting Software?
With the assistance of reporting software, the user may be able to identify information that is of value since the program creates links to data sources, gathers pertinent information, and shows observations in graphical images such as graphs and charts. This piece of software is often bundled with business intelligence packages.
Benefits
Rather than relying on Excel, businesses now have access to reporting software that offers options that are quicker, more accurate, and more efficient. They gather data from the database and create relevant reports in a fraction of the time it would typically take, so contributing to the automation of corporate reporting.
Features
Interactive reports enable you to get an in-depth understanding by exploring the data in more depth than is possible with static reports, which the user cannot modify. The data in these reports may be filtered, sorted, and viewed in a variety of ways. The essential components of any good reporting program include the following:
- Business intelligence
- Visualization
- Self-service reporting
- Enterprise reporting
- Application performance reporting
- Financial reporting
Top 10 Reporting Software
1. Zoho Analytics
Zoho Analytics is equipped with an artificial intelligence-driven assistant that provides customers with insightful reports in response to any inquiries they may have about their data.
2. HubSpot Marketing Analytics
Built-in analytics, statistics, and dashboards allow you to monitor the health of your whole marketing funnel from a single location. Everything you need to become a more astute marketer can be found inside HubSpot Marketing Analytics.
3. Integrate.io
Marketing, sales, customer support, and coders may all find what they need at Integrate.io. Using Integrate.io, you can construct a whole marketing and sales analytics system.
4. FineReport
When it comes to handling the complicated requirements of reports and dashboards and gaining insights into corporate processes, organizations may rely on FineReport, a 100% java cms reporting software.
5. Query.me
When it comes to handling the complicated requirements of reporting dashboards and gaining insights into corporate processes, organizations may rely on FineReport, a 100% java reporting software.
6. Answer Rocket
Reports and big data analytics may be made by anybody on the team. Due to its web-based nature, Answer Rocket is compatible with any operating system.
7. SAP Crystal Reports
The SPA version of Crystal Reports has a user-friendly interface and streamlined workflow automation. Small and medium-sized businesses may utilize the tool with confidence knowing their data is safe.
8. Izenda Reports
Izenda Reports is a tool that can be used by development teams and software firms to include business intelligence and reporting capabilities in their applications.
9. DBxtra
DBxtra is an ad-hoc reporting and business intelligence tool. This reporting system is accessible through the web and includes a free desktop client for viewing reports.
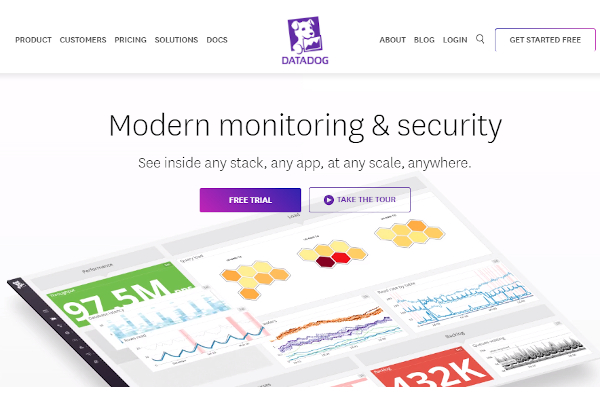
10. Datadog
Datadog was designed to keep tabs on and analyze data. Log management, dashboards, and alarms are just some of the features it offers for keeping tabs on application health.
FAQs
What makes an effective reporting tool?
A good dashboard will show data, but a great dashboard will be interactive. Visual data reporting is far more extensive. It not only provides data but also allows you to interact with it. The opportunity to communicate with the information in front of you aids users in better understanding the data and will enable you to take action.
What makes reporting strategy essential?
The goal of the reporting strategy is to secure sensitive data no matter where it exists or is being transferred inside the organization while yet allowing for sufficiently wide access to business data via data reporting channels.
Are reporting technologies important?
Reporting technology has increased openness in healthcare delivery for the elderly, showing how well healthcare professionals are performing and facilitating accurate and meaningful communication.
Business decisions are a crucial part of every successful company. The sooner you have an idea, the more useful it is, thus it’s important to have reports based on high-quality data as soon as feasible. Having access to reliable data may shed light on many aspects of your company. Where, however, would one go to find them? Accessing insights into your findings may be simplified and automated with the help of numerous reporting tools. Take care to choose a tool that is a good fit for your business in terms of both meeting your needs and producing results rapidly.
Related Posts
10+ Best Chemical Software for Windows, Mac, Android 2022
12+ Best Vulnerability Scanner Software for Windows, Mac, Android 2022
4+ Best Bundled Pay Management Software for Windows, Mac, Android 2022
10+ Best Trust Accounting Software for Windows, Mac, Android 2022
10+ Best Patient Portal Software for Windows, Mac, Android 2022
13+ Best Virtual Reality (VR) Software for Windows, Mac, Android 2022
12+ Best Bed and Breakfast Software for Windows, Mac, Android 2022
15+ Best Resort Management Software for Windows, Mac, Android 2022
14+ Best Hotel Channel Management Software for Windows, Mac, Android 2022
12+ Best Social Media Monitoring Software for Windows, Mac, Android 2022
10+ Best Transport Management Software for Windows, Mac, Android 2022
10+ Best Other Marketing Software for Windows, Mac, Android 2022
10+ Best Top Sales Enablement Software for Windows, Mac, Android 2022
8+ Best Industry Business Intelligence Software for Windows, Mac, Android 2022
10+ Best Insurance Agency Software for Windows, Mac, Android 2022