
You are a data scientist who would like to visualize your data qualitatively or quantitatively then you need a visualization software. The visualization tool allows data to be plotted in a variety of graphs. The software allows you to give good insights into your data. We review the best visualization software available for review. We will look at the unique features of different visualization tools. The software is available as a free download. Some of the products come at a price.
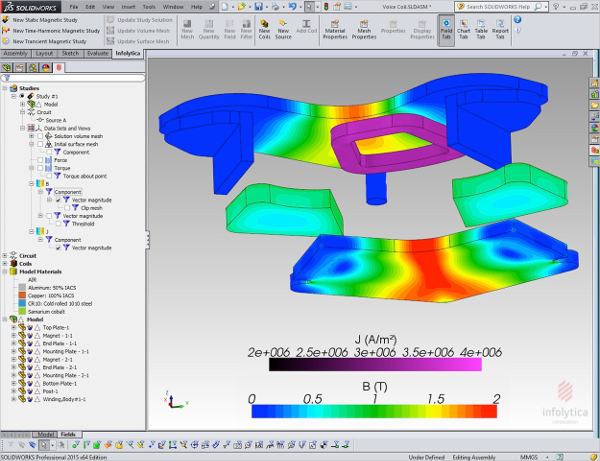
ParaView
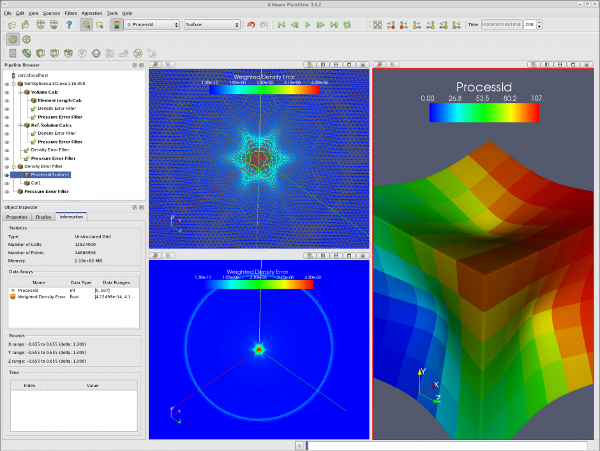
ParaView is an open source multi-platform data analysis and visualization tool. You can quickly build the visualization for the data you have provided. It supports complex mathematical formula. It is used to compute large datasets which run in memory on supercomputers. It is used for weather forecasting and climate research type of application.
Inetsoft
Visualize free is a free tool which is based on the advanced commercial dashboard and visualization software developed by Inetsoft. It allows you to sift through multidimensional data to spot trends and any deviations. You can slice and dice data with a simple point and click methods. It helps you in charting very effectively.
Qlik
Qlik allows you to create dashboards and visualizations very easily. It is a powerful tool for getting the right answers from your data. It can be used by all departments within the organization for analyzing the data. You have the ability to share the data with others for discussions.
Visualization Software on Other Platforms
The visualization software needs to run on Windows, Linux, and Mac platforms. The data needs to be seen on mobiles and tablets which are based on IOS and Android. We will review the software which runs on these platforms or all other platforms.
Tulip Data Visualization for Windows
The software is an information visualization framework for analyzing and visualizing data from relational databases. It provides the developer with tools to develop the visualization software for the data problem he wishes to solve. It is built on C++ which makes it fast. Developers can reuse its components to speed up the development process.
VTK Visualization for Linux
VTK Visualization is a Linux based application. It has multiple filters which can be applied to the data for visualization. Every filter is connected to a VTK algorithm that can be used. The connected algorithms can create a data flow network. VTK has hundreds of algorithms to work with.
Gephi for Mac
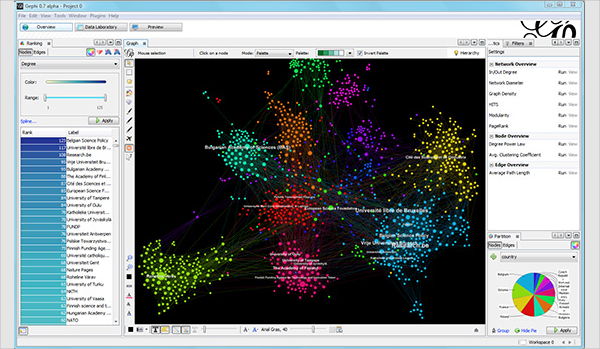
Gephi is an open source free data visualization tool. The tool is for the data analyst and scientists to study and understand graphs. It provides real-time visualization. It iterates through visualization using dynamic filtering. Layout algorithm provides shapes to the graphs. The statistics and metrics framework provides most common metrics for social network analysis.
Tableau – Most Popular Software
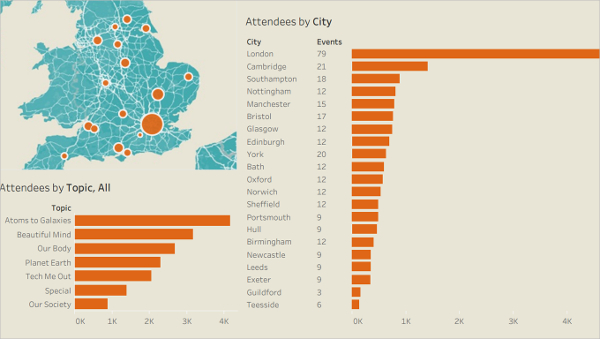
Tableau Public is a free software available to visualize your data. You can download the application to start using it very quickly. You can connect to your data source to do data analysis. You can save your visualization on the public cloud provided by Tableau. You can share your visualization to other people to collaborate. You can also see Wind Simulation Software
How To Install Visualization Software?
The visualization tool needs to be download from the publisher’s website. It is a good idea to read the release guide and installation guide from the vendor. We can then start the installation process. We can refer to the installation guide for any answers or just follow the same. The software will get installed within a few minutes. You can launch the software to see whether it is working. You may try few functions that to be satisfied with the installation. You can also see Data Analytics Software
We have reviewed data visualization software which allows you to access the data, visualize it, save it to a dashboard and collaborate with other people. One of the tools allows developers to build custom visualization tools. You can use any of the software reviewed above for your data visualization needs.
Related Posts
10+ Best Trust Accounting Software for Windows, Mac, Android 2022
10+ Best Patient Portal Software for Windows, Mac, Android 2022
13+ Best Virtual Reality (VR) Software for Windows, Mac, Android 2022
12+ Best Bed and Breakfast Software for Windows, Mac, Android 2022
15+ Best Resort Management Software for Windows, Mac, Android 2022
14+ Best Hotel Channel Management Software for Windows, Mac, Android 2022
12+ Best Social Media Monitoring Software for Windows, Mac, Android 2022
10+ Best Transport Management Software for Windows, Mac, Android 2022
10+ Best Other Marketing Software for Windows, Mac, Android 2022
10+ Best Top Sales Enablement Software for Windows, Mac, Android 2022
8+ Best Industry Business Intelligence Software for Windows, Mac, Android 2022
10+ Best Insurance Agency Software for Windows, Mac, Android 2022
10+ Best Leave Management Software for Windows, Mac, Android 2022
10+ Best Mobile Event Apps Software for Windows, Mac, Android 2022
10+ Best Online CRM Software for Windows, Mac, Android 2022