
Visualization software includes a whole range of computer graphic products. These are used for creating of interfaces for applications or for creating graphical displays. They have libraries of different graphical components. They include editors to build and deploy these displays of data and are used in various applications and in various industries.
Data Visualization Software
Data Visualization Software allows users to prepare, analyze and also to visualize complex data. This is an end to end solution where growing data sets are tackled from different sources and terabytes of data can be crunched. This also helps with supporting various users on a single server.
Tableau Public
Visually
Sisense
AVS Data Visualization

Dundas

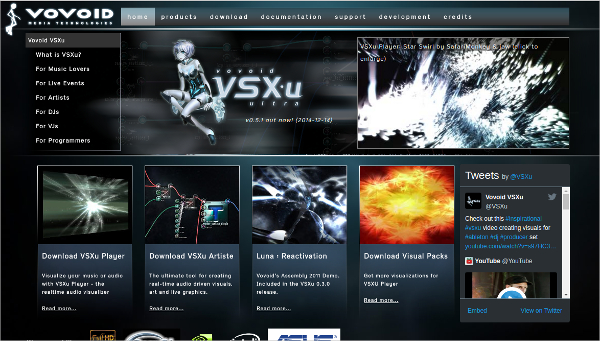
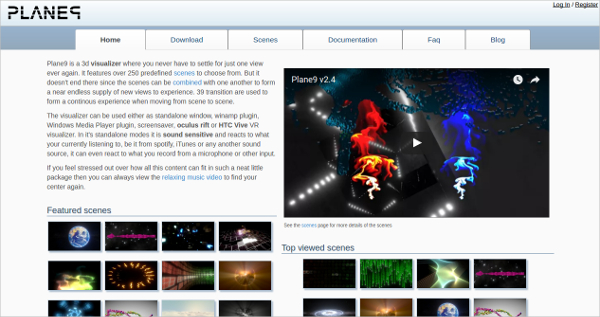
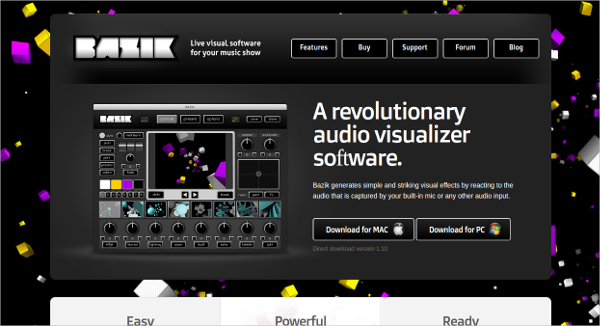
Music Visualization Software
Music Visualization Software helps with various aspects such as showing and hiding the help screen, changing the mode, color palette, displaying information about the track, auto cycle, camera lock as well as freeze mode toggles and more. Smoke in the background can also be either hidden or shown. These add more attraction to the music as the music is visualized and not only heard.
Magic
Vovoid VSXu
Plane9
Bazik
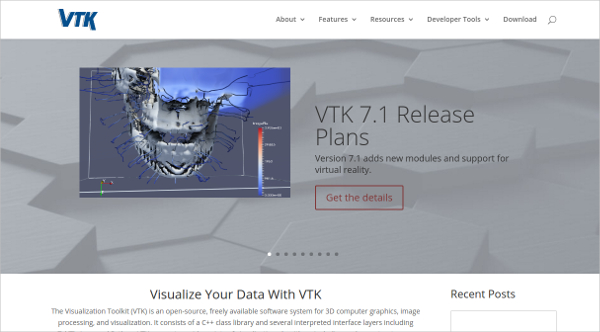
3D Visualization Software
3D Visualization Software is powerful and simple to use as well. It works with 3D printers and it has an intuitive graphical user interface. The toolbox is placed on the top and there are view tools under it. The rest of the space is dedicated to the design area. This allows importing of SVG files too.
Autodesk Showcase

LUMION 7.0

Visualization Toolkit
Gatan 3D Visualization Software

Network Visualization Software
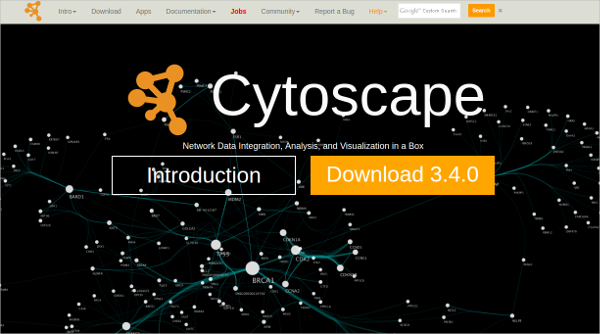
Network Visualization Software can be used for several purposes. You can enter a network edge list, click on a button and you can see the network graph. The appearance of the graph is customizable, you can zoom it, scale it as well as pan the graph. There are filter vertices and dynamic edges. You can even find clusters and calculate metrics of the graph. You can even get networks from Flickr, Twitter, Youtube and more.
Gephi

Cytoscape
Commetrix

SOCIAL NETWORK VISUALIZER

Molecular Visualization Software
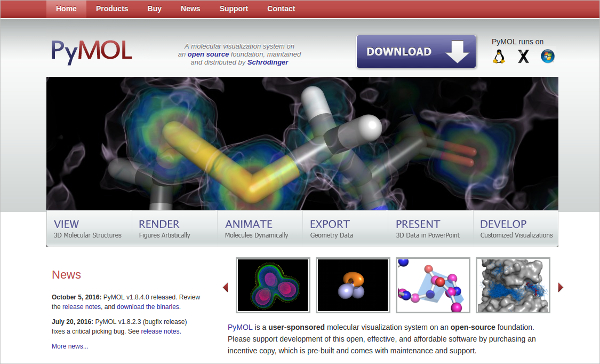
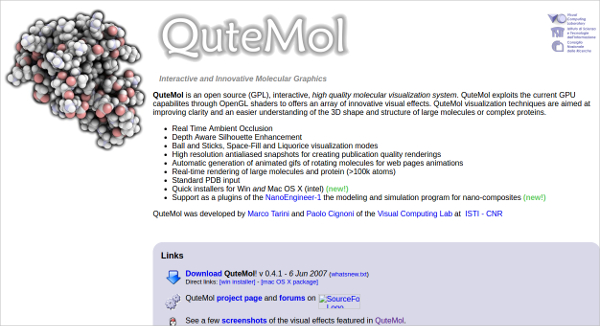
Molecular Visualization Software are available in stand-alone as well as in applet forms. It is used in Interactive 3D complement pages which are in Protopeia, in Interactive 3D figures as well as in journals for interactive displays in 3D
PyMOL
OpenRasMol

QuteMol
Diamond

Room Visualization Software
Room Visualization Software is extensive and a free room tool for designing. You can design even the smallest details such as stairs, windows, walls or partitions. You can even do landscaping and pools with it. This is great for those who are designing or remodeling or even renovating. It gives 3D views so the client can see what he or she will get.
Room Sketcher

Cylindo Room Planner

Roomle 3D

Tile Visualizer

Text Visualization Software
Text Visualization Software is used for analyzing textual data and it allows CAQDAS features. It allows for importing of documents in various forms, importing qualitative coding as well as using the codes which are into tree structures. You can even add memos and comments to segments.
Textexture

Voyant Tools

Process Visualization Software
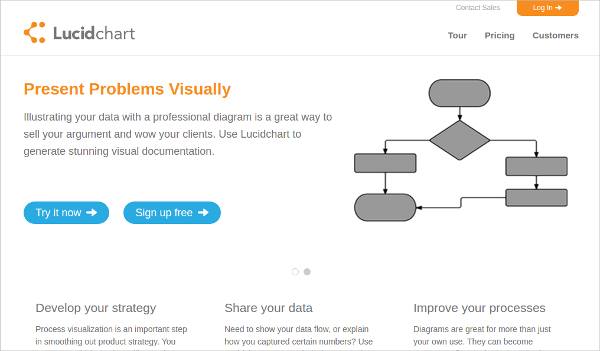
Process Visualization Software helps to use the data you have to improve your operations. It allows you to explore processes of sales, various marketing campaigns, customer care as well as all kinds of web activity. You can even create functions and use it for promotions, customer satisfaction and products.
Lucidchart Process Visualization Software
PVBrowser

Geometry Visualization Software
Geometry Visualization Software is the program to alleviate the difficulties in construction and to teach complex designs and constructions. It allows algebraic concepts to be created and variable elements in the figure to be explored and observed.
GeoGebra

Cabri 3D

JavaView

CAD Visualization Software
CAD Visualization Software helps in structural analysis. Users are able to model as well as to solve complex 3D structures. It does not require installations and the results of Bending, stress, shear force, axial force, deflection and more are possible with it.
Actify CAD Visualization Software

NX for Design

CAD Studio

Using visualization software information can be absorbed better, it helps in visualizing of patterns as well as relationships between various activities and operations. It helps in acting on emerging trends and manipulating as well as interacting with data directly. The above are the best different types of visualization software which help to visualize your data into patterns, trends, correlations. Also by using these software one can create charts to understand the process in an easy way.
Related Posts
10+ Best Trust Accounting Software for Windows, Mac, Android 2022
10+ Best Patient Portal Software for Windows, Mac, Android 2022
13+ Best Virtual Reality (VR) Software for Windows, Mac, Android 2022
12+ Best Bed and Breakfast Software for Windows, Mac, Android 2022
15+ Best Resort Management Software for Windows, Mac, Android 2022
14+ Best Hotel Channel Management Software for Windows, Mac, Android 2022
12+ Best Social Media Monitoring Software for Windows, Mac, Android 2022
10+ Best Transport Management Software for Windows, Mac, Android 2022
10+ Best Other Marketing Software for Windows, Mac, Android 2022
10+ Best Top Sales Enablement Software for Windows, Mac, Android 2022
8+ Best Industry Business Intelligence Software for Windows, Mac, Android 2022
10+ Best Insurance Agency Software for Windows, Mac, Android 2022
10+ Best Leave Management Software for Windows, Mac, Android 2022
10+ Best Mobile Event Apps Software for Windows, Mac, Android 2022
10+ Best Online CRM Software for Windows, Mac, Android 2022